Whenever I think I have seen everything there is to see in the field of NMR spectroscopy, I come across something unexpected, as in this case.
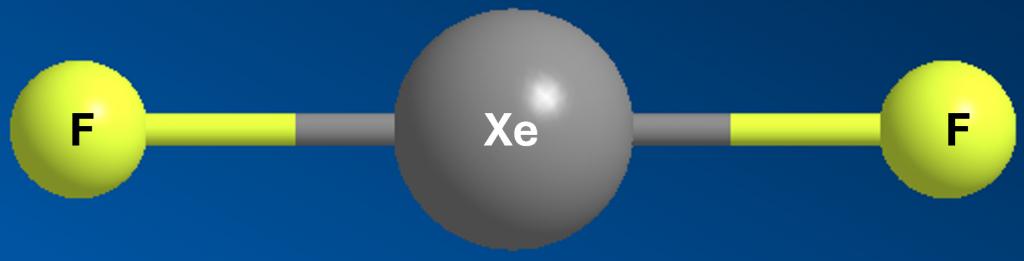
XeF2 is a small but spectacular molecule and therefore a good starting point for this blog. Since its first synthesis in 1962 by Rudolf Hoppe1, this compound has been extensively studied for its chemical and spectroscopic properties. I was lucky enough to have an NMR sample of XeF2 in CD3CN brought to me by one of our Ph.D. students, who funnily enough has the same last name as the discoverer of the molecule. The first thing I did was to measure the 129Xe spectrum.
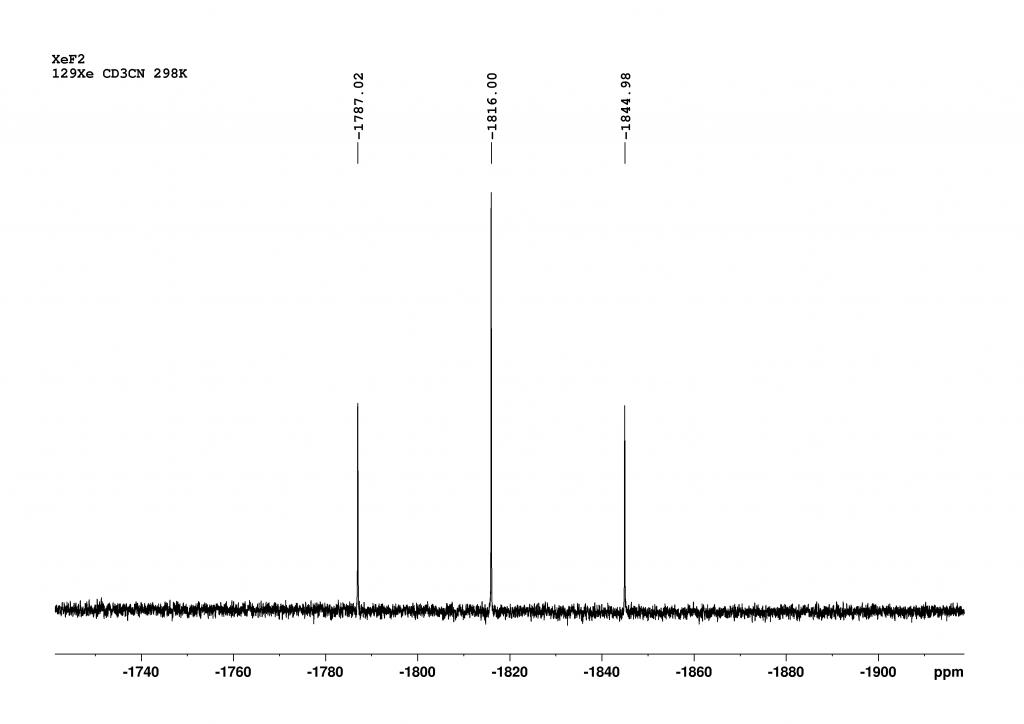
Figure 1: NMR of XeF2 measured in CD3CN at 298 K with a 700 MHz NMR spectrometer (128 Scans, AQ= 4 min, FWHM=18 Hz).
Chemical shifts are given relative to XeOF4 (= 0 ppm).
The measurement was kept as short as possible to ensure that the solution did not contain any decomposition products. XeF2 is so reactive that it slowly degrades through the glass wall of the tube2. However, this great caution was not necessary as the lifetime of XeF2 in CD3CN is more than sufficient. In addition, the receptivity of 129Xe is 33 times higher than that of 13C, resulting in a good signal-to-noise ratio (SNR) even with short measurement times.
129Xe spectrum
Although the sample was very precisely tempered to 298 K, the chemical shift found of -1816 ppm will have a small error as we had no reference. However, the fact that this error is not very large can be seen from the correlability of our data in CD2Cl2 with literature values. For example, the chemical shift in CD2Cl2 at 263 K was given as a value of -1850 ppm. The authors state that the chemical shift changes by -0.64 ppm/K.3 Extrapolated to 298 K, this means that a chemical shift of -1874 ppm is to be expected, which is in excellent agreement with the value of -1875 ppm that we found. The significant difference in chemical shifts between CD3CN and CD2Cl2 demonstrates the sensitivity of 129Xe to its environment.
As expected, the coupling with the fluorine atoms results in a triplet. The magnitude of the 1JXeF coupling constant is 5645 Hz in CD3CN and 5600 Hz in CD2Cl2, which falls within the range of values reported in the literature.4,5 The solvent therefore also has a noticeable effect on the coupling constant. As always, only the magnitude of the coupling constant can be obtained from the 1D spectrum. In fact, the 1JXeF coupling constant is negative because, as theorists have shown, all Ramsey terms contributing to the coupling constant are negative.6
19F Spectrum
To be honest, I only included the 19F spectrum for the sake of completeness and didn’t expect any surprises. At first glance, it looks as expected.
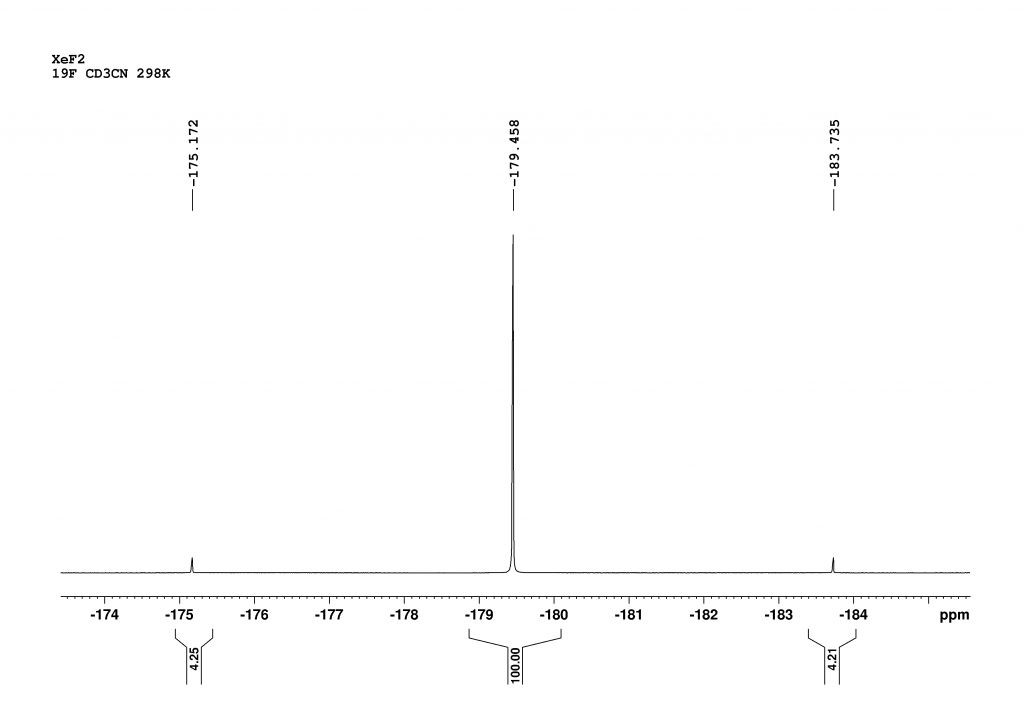
Figure 2: 19F spectrum of XeF2 in CD3CN measured at 298 K with a 700 MHz spectrometer (1 Scan, no dummy scans). The spectrum is shown with reference to CFCl3 (= 0 ppm).
There are two signals in the spectrum. The middle peak shows the chemical shift of all the fluorine atoms that are not bound to 129Xe and 131Xe (52.3% of all Xe atoms). The signals of the 19F atoms bound to 131Xe disappear due to very fast relaxation in the baseline (see below). The two outer peaks are a doublet (1JXeF = 5645 Hz) resulting from the coupling of the fluorine atoms bound to 129Xe (26.4% natural abundance). At this point a detective story begins as the integrals obviously do not reflect the natural abundances of the isotopomers. According to the integrals in the spectrum, the natural abundance of 129Xe should be only 7.8%. To rule out the possibility of relaxation effects influencing the integrals, the spectrum was recorded with only one scan and without dummy scans. We waited 5 minutes before the scan. Even if the 19F atoms were excited when setting up the sample (determining the receiver gain), this time is more than sufficient to reach equilibrium, given that the T1 time of the 19F atoms in the solvent CD3CN is approximately 10 seconds.7 I discussed this with a very experienced colleague, who said that the 129Xe in the sample could be depleted, but we had no idea why.
During my literature search for 19F measurements on XeF₂, I came across a very interesting paper by Jokisaari and Schrobligen et al.8 They had carried out measurements in CD3CN at -16°C, which significantly improved the resolution of the 19F spectrum. We therefore repeated the 19F measurement at -25°C in CD3CN, which enabled us to differentiate most of the isotopomers, as described by the authors.
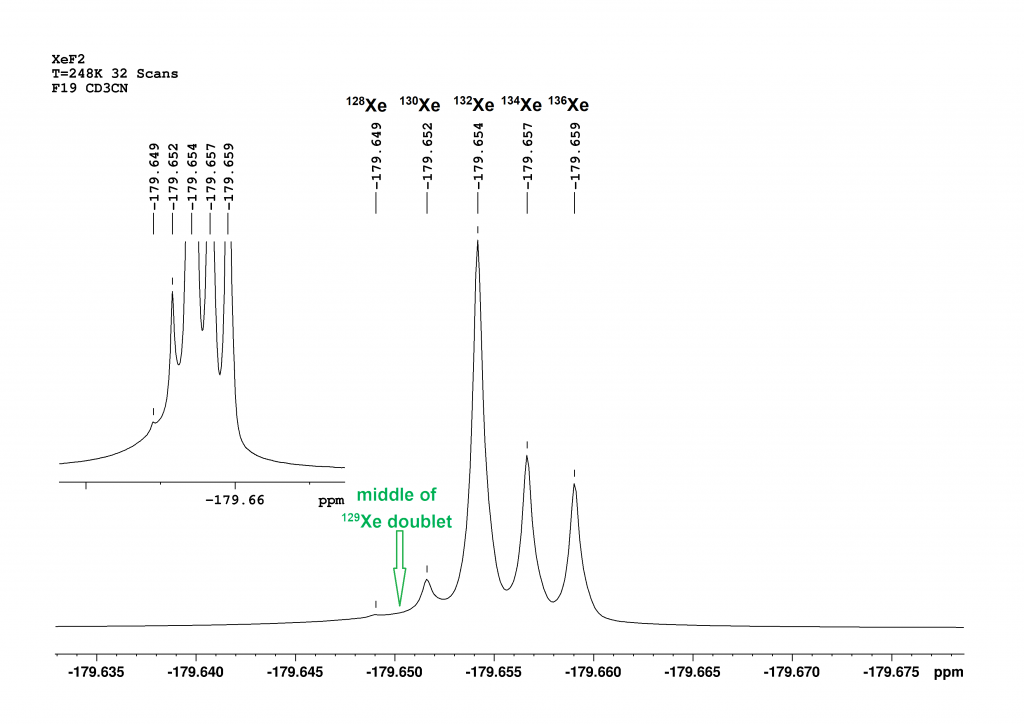
Figure 3: This is a section of the 19F spectrum of XeF₂ at -25°C in CD₃CN. The central signal, composed of the peaks of the isotopomers 128Xe, 130Xe, 132Xe, 134Xe and 136Xe, is shown.
Compared to the spectrum at 25°C (Figure 2), five isotopomers can now be distinguished in the central signal area. Figure 3 shows that the intensity of the signals approximately corresponds to their natural abundances [126Xe (0.09%), 128Xe (1.9%), 130Xe (4.1%), 132Xe (26.9%), 134Xe (10.4%), 136Xe (8.9%)]9. The 129XeF₂ doublet lies outside the section. The centre of the doublet is calculated to be almost exactly between the peaks of 128XeF2 and 130XeF2. The associated integral still does not correspond to the natural abundance of 129Xe. The abundance is only 7.8% here, too. The sequence of chemical shifts correlates well with the mass of the isotopomers. The greater the mass, the stronger the high-field shift of the peak. An increase in the mass number by 2 leads to a primary isotope shift of -2 to -3 ppb.
To solve the mystery of the isotopomers, I asked the PhD student who had prepared the sample for me (thanks Axel!) to measure a mass spectrum of the solid XeF2. The following figure shows the result.
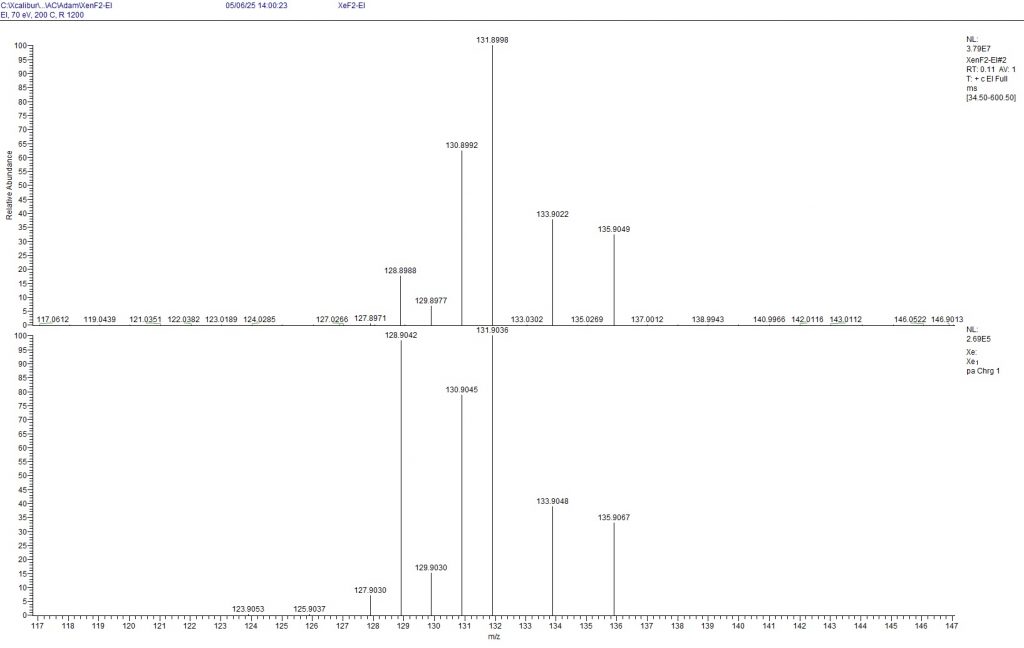
Figure 4: Mass spectrum of XeF2 (top) measured with EI (70 eV). The isotope distribution of Xe+ is shown. The natural isotope distribution is shown below for comparison (To enlarge the image, point to the image with the mouse and press the Ctrl key twice.)
The mass spectrometric measurements show that all isotopes from 128Xe to 131Xe are depleted, while all isotopes from 132Xe to 136Xe are enriched. According to the measurement, only 6.9% of 129Xe is present in the mixture, which agrees surprisingly well with the NMR measurements presented above. The results of the mass spectrometry compared to the NMR results also indicate that the 19F signal of 131XeF2 is not recognisable, but was probably integrated as a very broad peak among the other signals in the -179.65 ppm range.
I did a little research on the internet about the enrichment of 129Xe and it seems that 129Xe is indeed enriched on a large scale for medical purposes. It is used very successfully as hyperpolarised 129Xe in MRI examinations of the human lung.10
We contacted the XeF₂ vendor and provided them with the measurement results. They were unaware that their product did not have the natural distribution of xenon isotopes, which could cause major spectroscopic problems for their customers. I am sure the vendor will ask his xenon supplier some questions…
- https://doi.org/10.1002/ange.19620742213 ↩︎
- http://dx.doi.org/10.3998/ark.5550190.p008.436 ↩︎
- https://doi.org/10.1002/mrc.1799 ↩︎
- https://doi.org/10.1002/zaac.19744090309 ↩︎
- M. Tramsek, B. Zemva, Acta Chim. Slov. 2006, 53, 105–116. ↩︎
- https://doi.org/10.1016/j.cplett.2006.06.099 ↩︎
- https://doi.org/10.1006/jmra.1994.1241 ↩︎
- 10.1002/mrc.1260320410 ↩︎
- The values in brackets are the natural abundances, not the values from the spectrum! ↩︎
- https://doi.org/10.3791/65982 ↩︎
Leave a Reply