There is no spoon

NMR+Sample Changer

Tag: deuteration

NMR of [Co(en)3]3+ (Part II)

After seeing the spectacular 59CO spectra of [Co(en)3]3+in D2O,1 I thought that this could be improved upon. The impetus for this came from papers by Borer et al.2 and Iida et al.3 that described the spectroscopic differentiation of the two enantiomers of the complex using sodium tartrate and 59Co NMR spectroscopy.
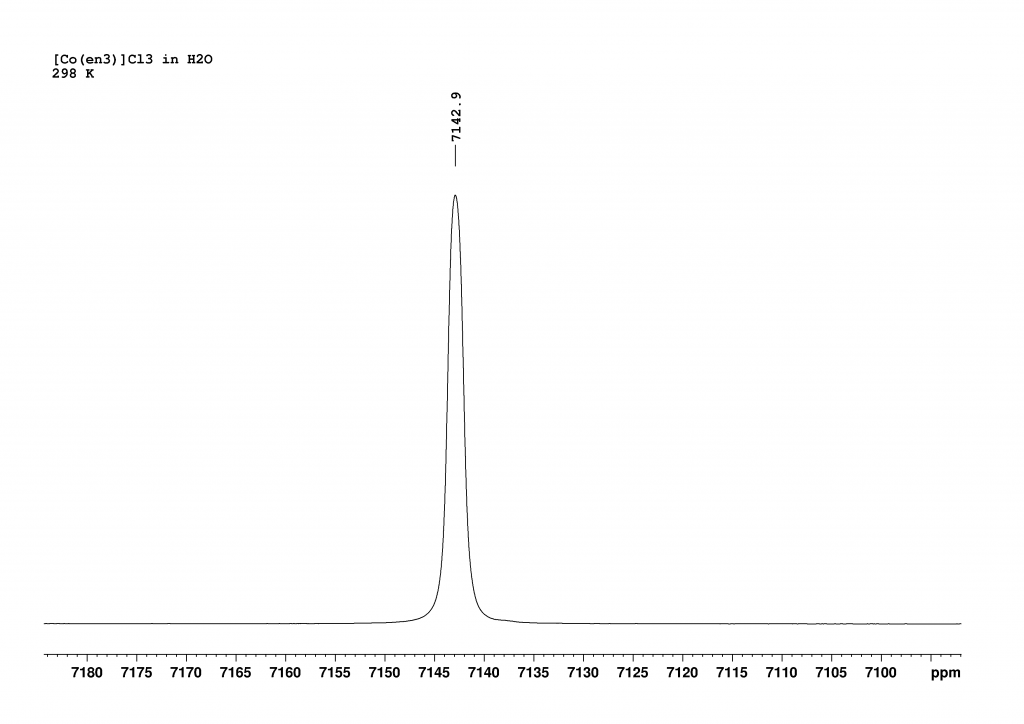
Firstly, I recorded the 59Co NMR spectrum of [Co(en)3]3+ in H2O. This revealed a single peak, which combined the signals of the two enantiomers (Δ and Λ isomers in a ratio of 1:1).

59Co spectrum of [Co(en)3]Cl3 dissolved in H2O at 298K. The spectrum was recorded using a 700 MHz NMR spectrometer operating at a frequency of 163.2 MHz.

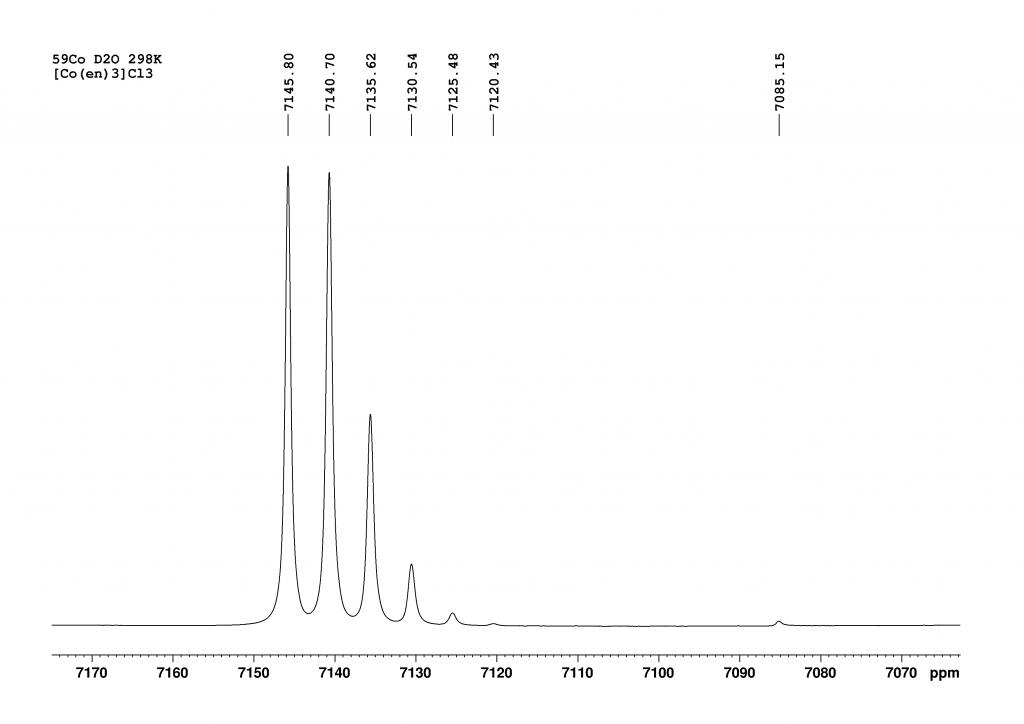
The addition of L-(+)sodium tartrate has a surprisingly clear effect. The original peak splits into two new peaks that are shifted to higher field.

Excess L(+)-sodium tartrate produces two peaks, which correspond to the presence of two enantiomeric complexes. The peak at 7123.1 ppm corresponds to the Λ-isomer and the peak at 7126.7 ppm corresponds to the Δ-isomer.

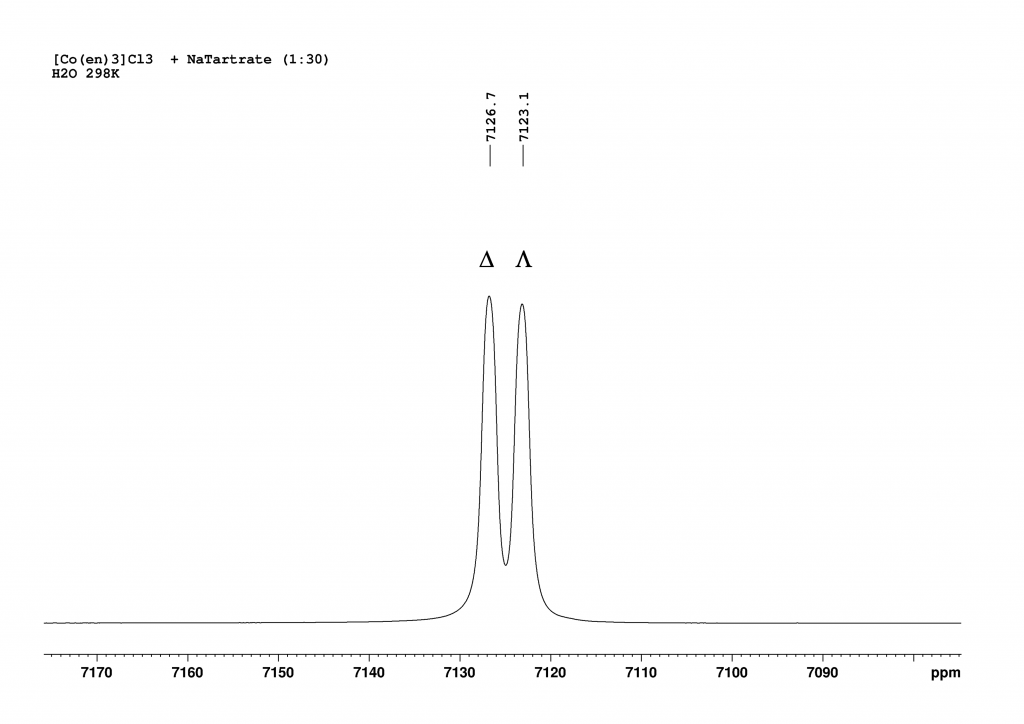
Deconvolution of the two peaks shows that they are in an integrative ratio of exactly 1:1. The cause of the splitting in solution lies in the formation of contact ion pairs, which behave like diastereomers in solution and thus result in separate 59Co signals for each enantiomeric complex.3
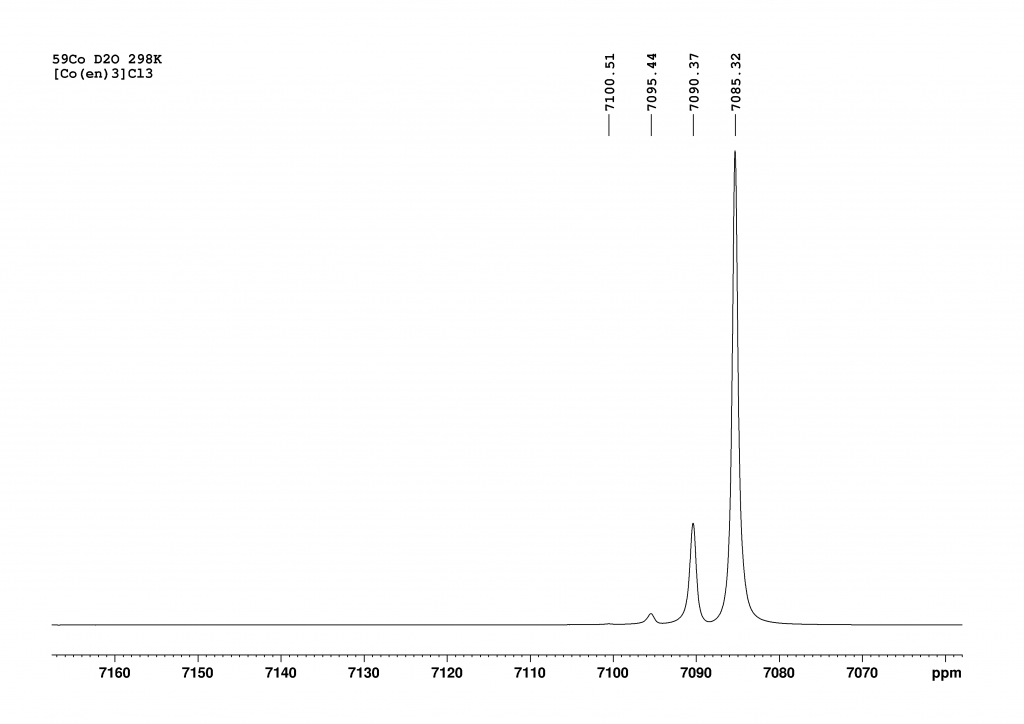
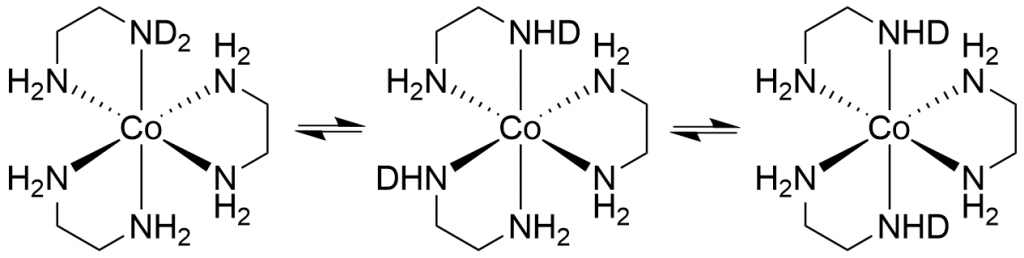
Part I of this post reported that the complex [Co(en)3]+ forms isotopomers when dissolved in D2O through H/D exchange, all of which exhibit their own 59Co NMR signal.
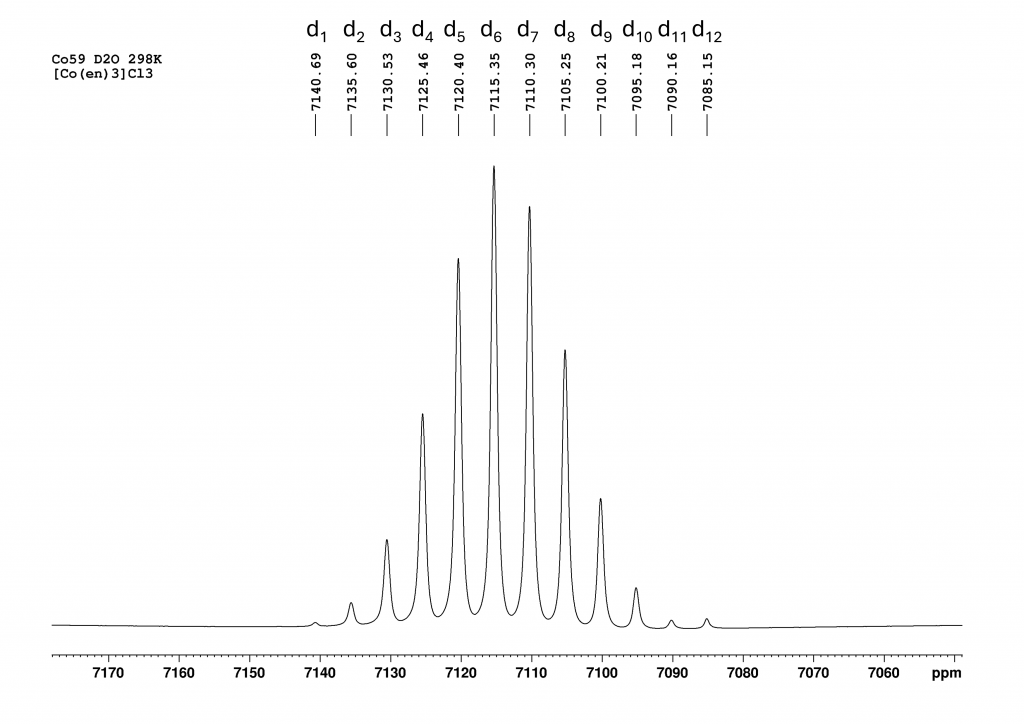
This naturally raised the question of what would happen if D2O was added to the solution of the complex in H2O with sodium tartrate. I hoped that each signal from the two enantiomers would be further split into the corresponding isotopomers. To my great delight, this is exactly what happened. The resulting spectrum is one of the most spectacular spectra I have ever measured.

59Co spectrum of a mixture of [Co(en)3]Cl3 with excess sodium tartrate in H2O/D2O (approx. 1/1.5). The 24 peaks are caused by the splitting of the 12 possible isotopomers (d1 to d12) into the signals of both enantiomeric complexes(Λ and Δ-isomer).

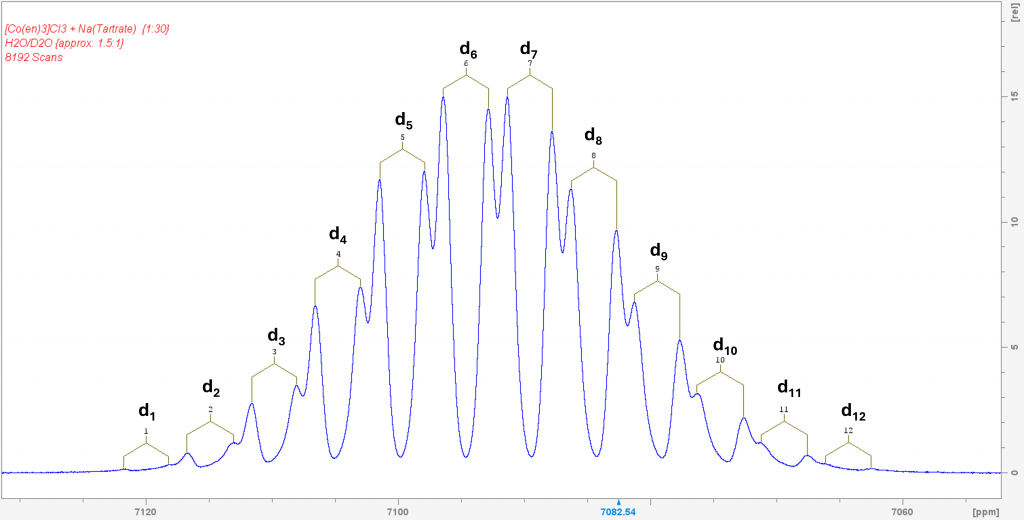
This spectrum was obtained by recording 8192 scans in order to extract the signals of the low-concentration isotopomers d1 and d12 from the noise. The two signals of the isotopomer d0 are missing because its concentration is so low that its signals are lost in the noise. The spectrum shows the isotopomers in equilibrium. Even after 7 days, it remains unchanged. This means that the isotopomer distribution can ultimately be controlled via the H2O/D2O ratio, which is also reported in the literature. To be honest, I was lucky to have hit the H2O/D2O ratio in such a way that the isotopomers d6 and d7 form the maximum.

14N NMR of [Co(en)3]3+

To complete the investigation of [Co(en)3]3+, it seemed sensible to record a nitrogen NMR spectrum. All my attempts to produce a 15N-HMBC spectrum failed miserably. The ligand’s protons produce relatively broad peaks in the 1H NMR spectrum, which probably prevents polarisation transfer to the 15N atoms. I was also unable to find any 15N data in the literature.
The last option was therefore 14N NMR spectroscopy. Fortunately, the appropriate measuring head on our 500 MHz spectrometer had recently been repaired, enabling us to carry out the measurements promptly. Since the signals from primary amines typically appear in the range of 20 to 30 ppm (reference fl. NH3 = 0 ppm) and no dramatic shift was expected due to the coordination of ethylenediamine on cobalt, we searched in a window around this range and were rewarded with a broad signal at -17 ppm.

14N NMR of [Co(en)3]Cl3 in H2O.

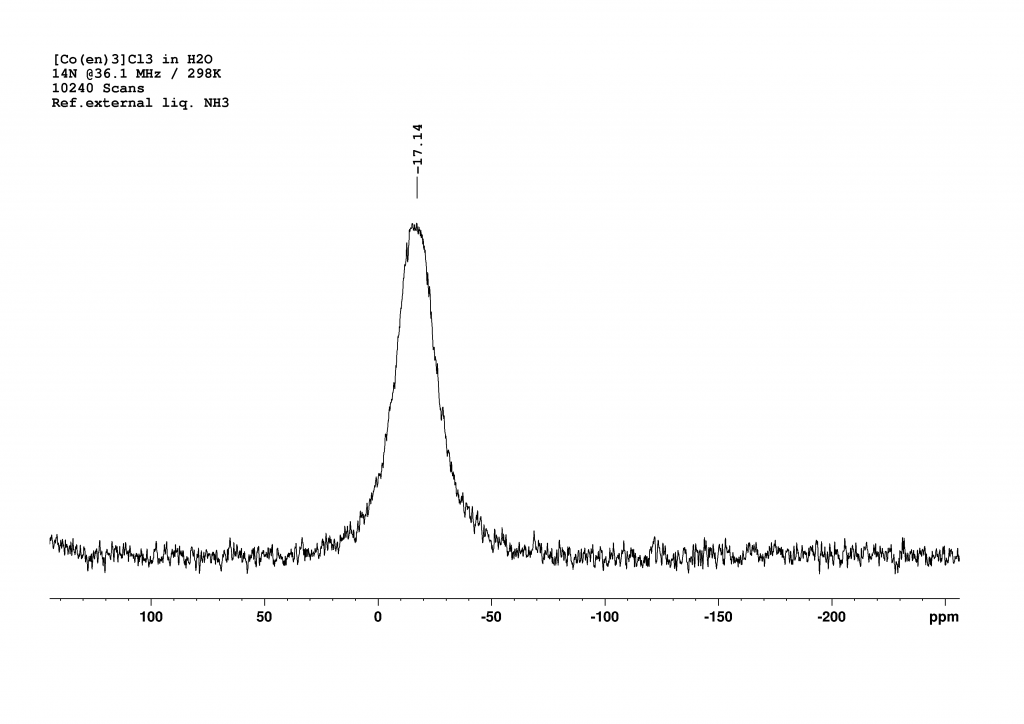
A measurement time of 48 minutes (10240 scans, with a relaxation delay of 0.01 s and an acquisition time of 0.28 s) was necessary to obtain a good spectrum. The peak is very broad (FWHM = 720 Hz), which is unsurprising given that the nitrogen atoms are not symmetrically surrounded. I was somewhat surprised that the nitrogen atoms are more strongly shielded than in the free ligand. I currently have no explanation for this.

  1. 59Co NMR of [Co(en)3]3+ – NMR Blog ↩︎
  2. https://pubs.acs.org/doi/abs/10.1021/ed079p494 ↩︎
  3. https://doi.org/10.1246/bcsj.68.1337 ↩︎
  4. https://doi.org/10.1246/bcsj.68.1337 ↩︎

NMR of [Co(en)3]3+ (Part I)

The [Co(en)3]3+ complex is one of the classic complexes of coordination chemistry. Its stereochemistry was first correctly described by Alfred Werner in 1911.1

Figure 1: The structure of Δ-λλλ-[Co(en)3]3+ cation (point group D3)

Trisethylenediamine complexes such as the cation shown in Figure 1 are always chiral. The chirality is based on the helical arrangement of the ligands (Δ or Λ isomer) and the conformation of the ligands (δ or λ), which do not form planar rings with the metal. The complexes are either D3– or C2-symmetric, depending on the conformations of the rings. The stereochemistry of such complexes is nicely explained in a detailed review article.2 The conformation of the rings plays no role in NMR spectra of this complex, as they transform into each other so quickly that the spectrometer can only measure averaged chemical shifts.
In 2024, I had the opportunity to measure a solution of [Co(en)3]Cl3 in D2O. The focus was on the 59Co spectrum, as we had not yet investigated a cobalt complex apart from the standard K3[Co(CN)6] (= 0 ppm). Since the cobalt atom in [Co(en)3]3+ is located in a very symmetrical environment, the nuclear quadrupole of 59Co should not play a significant role. Therefore, I expected a sharp, easy to measure singlet. The spectrum recorded 30 minutes after preparing the sample surprised me.

Figure 2: 59Co NMR spectrum of [Co(en)3]Cl3 and D2O. Recorded approximately 30 minutes after sample preparation on a 700 MHz spectrometer at 298 K. Seven isotopomers can be seen (see discussion).

As expected, the spectrum had a very good signal to noise ratio but instead of the expected singlet, 7 peaks were visible. My first thought was that the solid we had dissolved was heavily contaminated. I was about to dispose of the sample when I noticed that the 6 peaks at low field were almost exactly 5 ppm away from their neighboring peaks. This could not be a coincidence and could not be explained by random decomposition products or impurities. However, I definitely thought the peak at high field (7085 ppm) was an impurity – a clear misjudgment.
About 24 hours after the first measurement, I wanted to look at the same sample again and repeated the measurement. This time I was really amazed by the mesmerizing spectrum I got.

Figure 3: 59Co NMR spectrum of the isotopomers of [Co(en)3]Cl3 in D2O. Recorded approximately 24 hours after sample preparation on a 700 MHz spectrometer at 298 K.

Now 12 peaks can be observed at intervals of 5 ppm and it can be seen that the signal at 7085 ppm also belongs to this ensemble of peaks. After a brief literature search, it quickly became clear what was going on here. The 12 peaks from low to high field are the isotopomers d1 to d12-[Co(en)3]3+, which were formed by H/D exchange of the NH2 protons.  The signal of the non-deuterated complex (d0) has already disappeared.By integrating the CH2 protons of the ethylenediamine ligands against the remaining NH protons, the degree of deuteration can be determined at this point, which corresponds to nearby 50%. The isotope effect caused by the successive deuteration of the NH2 groups has been known since the 1980s and the kinetics of this reaction were already studied in detail at that time by Harris et al. with the aid of 59Co NMR.3 At the time, the authors only had access to a 100 MHz NMR spectrometer. The analysis of the spectra therefore had to be carried out using deconvolution. From this perspective, the kinetic analyses described are all the more impressive. In a publication by Zardrozny et al. from 2022, it was proposed to use this H/D exchange for a molecular thermometer.4

Figure 3: 59Co NMR spectrum of the isotopomers of [Co(en)3]Cl3 in D2O at equilibrium. Recorded approximately 1 week after sample preparation on a 700 MHz spectrometer at 298 K.

After approximately 1 week, only 4 peaks can finally be observed, with the peak at 7085 ppm (d12-complex) now dominant. The degree of deuteration is now at 98%, which agrees very well with the literature value of Harris et al. who observed the complexes d12 to d10 at equilibrium. With our much more powerful spectrometer, we also see the d9-complex at 7100.5 ppm. Due to the protons in solution, a small proportion of NH species always remains in equilibrium.
While I was working on the spectra, the question arose as to why there should only be 13 peaks (d0 to d12). In fact, there should be many more, because for most isotopomers (except d0, d1, d11 and d12) there are stereoisomers that should increase the number of peaks. For example, if we consider only the case d2, there are 3 stereoisomers (see Figure 4).

Figure 4: Stereoisomers of d2-[Co(en)3]3+

In the first there is simply an ND2 group, in the second the two NHD groups are in the cis position and in the third in the trans position. Since we only see one signal for these 3 isomers in the 59Co spectrum, I assume that there is a very fast intramolecular H/D exchange, so that the spectrometer only shows an averaged signal over the chemical shifts of the 3 isomers. This can then also be assumed for all other isotopomers. This is probably also the reason why the signals always shift by 5 ppm with each additional deuterium. Because it is not the position of the deuterium atoms but only their number that determines the chemical shift.

  1. https://doi.org/10.1002/cber.19110440297 ↩︎
  2. https://doi.org/10.1039/C6CS00604C ↩︎
  3. https://doi.org/10.1039/F19848003071 ↩︎
  4. https://doi.org/10.1021/acs.inorgchem.1c03326 ↩︎

Powered by WordPress & Theme by Anders Norén